日拱一卒无有尽,功不唐捐终入海
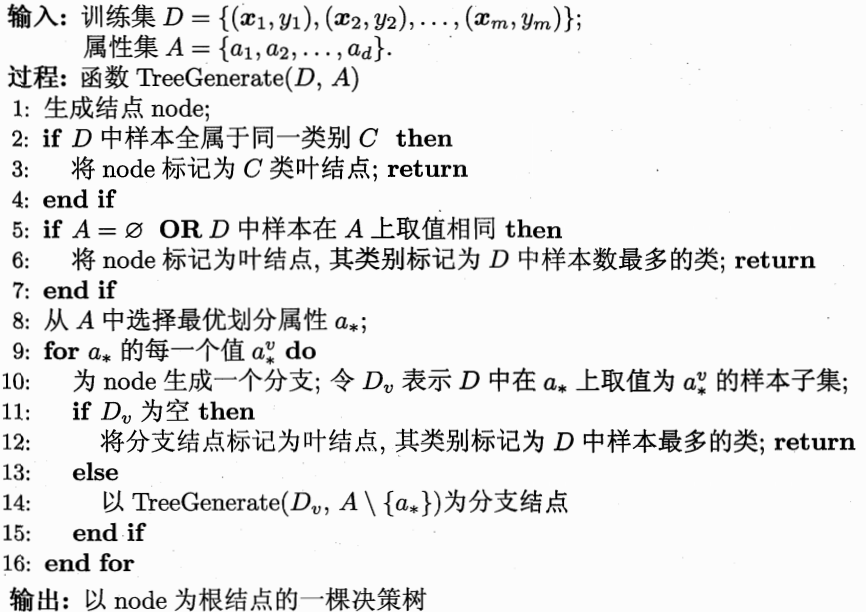
Basic Theories 1.Algorithm Priciple 分类,决策树每个内部结点 表示在一个属性上的一个测试,每个分支 代表一个测试输出,每个叶节点 代表一种类别。
Advantages:
①自学习
②可读性好
③效率高
Shannon ,the father of information theory,proposed the concept of “information entropy”.
在决策树分类中,随着划分过程不断进行,我们希望决策树分支结点所包含的样本尽可能属于同一类别,即:结点纯度(purity)越来越高。
信息论里面的信息与我们平时理解的不一样:
信息是消除随机不定性的事物。
小明今年18岁(√)
小明明年19岁(×)~也就是废话~
量化信息大小:信息熵。是描述消息中,不确定性 的值,熵越高,不确定性越高,可以理解为“混合的数据越多”。
假定当前样本集合 D中第 k类样本所占比例为 p_k(k=1,2,…,|y|),则信息熵定义为:
假定离散属性 a有 V个可能的取值
1
2
3
4
5
6
def cal_Ent (dataSet ): n = dataSet.shape[0 ] iset = dataSet.iloc[:,-1 ].value_counts() p = iset/n ent = (-p*np.log2(p)).sum () return ent
考虑到不同分支结点所包含的样本数不同,给分支结点赋予权重 对样本集
计算:信息增益 = 总的信息熵 — 知道某个信息后的信息熵
条件熵计算
eg:
Algorithm Implementation in Python 1.Core Problems ①如何从数据表中找到最佳节点和最佳分枝?
得到原始数据集,然后基于最好的属性值划分数据集。
②如何让决策树停止生长,防止过拟合?
过拟合判断:当训练集和测试集的准确率相差很大时(例如:训练集1.0,测试集0.8),可以认为模型过拟合。
过拟合的原因在于学习时过多地考虑如何提高对训练数据的正确分类,从而构建出过于复杂的决策树。解决这个问题的办法是考虑决策树的复杂度,对已生成的决策树进行简化,也就是常说的剪枝处理。
2.Implementation 这里使用ID3算法实现
(1)特征选择 ①计算信息熵和信息增益
②数据集最佳切分函数
1
2
3
4
5
6
7
8
9
10
11
12
13
14
15
16
17
18
19
20
21
22
23
24
25
26
27
28
29
30
31
32
33
34
35
""" 函数功能:根据信息增益选择出最佳数据集切分的列 参数说明: dataSet:原始数据集 返回: axis:数据集最佳切分列的索引 """ def bestSplit (dataSet ): baseEnt = calEnt(dataSet) bestGain = 0 axis = -1 for i in range (dataSet.shape[1 ]-1 ): levels= dataSet.iloc[:,i].value_counts().index ents = 0 for j in levels: childSet = dataSet[dataSet.iloc[:,i]==j] ent = calEnt(childSet) ents += (childSet.shape[0 ]/dataSet.shape[0 ])*ent infoGain = baseEnt-ents if (infoGain > bestGain): bestGain = infoGain axis = i return axis
③按照给定列切分数据集
1
2
3
4
5
6
7
8
9
10
11
12
13
14
""" 函数功能:按照给定的列划分数据集 参数说明: dataSet:原始数据集 axis:指定的列索引 value:指定的属性值 返回: redataSet:按照指定列索引和属性值切分后的数据集 """ def mySplit (dataSet,axis,value ): col = dataSet.columns[axis] redataSet = dataSet.loc[dataSet[col]==value,:].drop(col,axis=1 ) return redataSet
(2)决策树生成(构建决策树) ①开始,所有记录看作一个节点
②遍历每个特征的每一种分裂方式,找到最好的分裂特征(分裂点)
③分裂成两个或多个节点
④对分裂后的节点分别继续执行2-3步,直到每个节点足够“纯”为止
1
2
3
4
5
6
7
8
9
10
11
12
13
14
15
16
17
18
19
20
21
22
23
24
25
26
27
28
29
30
""" 函数功能:基于最大信息增益切分数据集,递归构建决策树 参数说明: dataSet:原始数据集(最后一列是标签) 返回: myTree:字典形式的树 """ def createTree (dataSet ): featlist = list (dataSet.columns) classlist = dataSet.iloc[:,-1 ].value_counts() if classlist[0 ]==dataSet.shape[0 ] or dataSet.shape[1 ] == 1 : return classlist.index[0 ] axis = bestSplit(dataSet) bestfeat = featlist[axis] myTree = {bestfeat:{}} del featlist[axis] valuelist = set (dataSet.iloc[:,axis]) for value in valuelist: myTree[bestfeat][value] = createTree(mySplit(dataSet,axis,value)) return myTree
(3)决策树存储 构造决策树是很耗时的任务,即使处理很小的数据集,也要花费几秒的时间,如果数据集很大,将会耗费很多计算时间。因此为了节省时间,建好树之后立马将其保存,后续使用直接调用即可。
1 2 3 4 5 6 7 8 9 np.save('myTree.npy' ,myTree) read_myTree = np.load('myTree.npy' ).item() read_myTree
(4)决策树分类 1 2 3 4 5 6 7 8 9 10 11 12 13 14 15 16 17 18 19 20 21 22 23 """ 函数功能:对一个测试实例进行分类 参数说明: inputTree:已经生成的决策树 labels:存储选择的最优特征标签 testVec:测试数据列表,顺序对应原数据集 返回: classLabel:分类结果 """ def classify (inputTree,labels, testVec ): firstStr = next (iter (inputTree)) secondDict = inputTree[firstStr] featIndex = labels.index(firstStr) for key in secondDict.keys(): if testVec[featIndex] == key: if type (secondDict[key]) == dict : classLabel = classify(secondDict[key], labels, testVec) else : classLabel = secondDict[key] return classLabel
1 2 3 4 5 6 7 8 9 10 11 12 13 14 15 16 17 18 19 20 21 """ 函数功能:对测试集进行预测,并返回预测后的结果 参数说明: train:训练集 test:测试集 返回: test:预测好分类的测试集 """ def acc_classify (train,test ): inputTree = createTree(train) labels = list (train.columns) result = [] for i in range (test.shape[0 ]): testVec = test.iloc[i,:-1 ] classLabel = classify(inputTree,labels,testVec) result.append(classLabel) test['predict' ]=result acc = (test.iloc[:,-1 ]==test.iloc[:,-2 ]).mean() print (f'模型预测准确率为{acc} ' ) return test
测试函数
1 2 3 train = dataSet test = dataSet.iloc[:3 ,:] acc_classify(train,test)
(5)决策树绘制 使用SKlearn中graphviz包
1 2 3 4 5 6 7 8 9 10 11 12 13 14 15 16 17 18 19 20 21 22 23 24 25 26 27 28 29 30 31 from sklearn import treefrom sklearn.tree import DecisionTreeClassifierimport graphvizXtrain = dataSet.iloc[:,:-1 ] Ytrain = dataSet.iloc[:,-1 ] labels = Ytrain.unique().tolist() Ytrain = Ytrain.apply(lambda x: labels.index(x)) clf = DecisionTreeClassifier() clf = clf.fit(Xtrain, Ytrain) tree.export_graphviz(clf) dot_data = tree.export_graphviz(clf, out_file=None ) graphviz.Source(dot_data) dot_data = tree.export_graphviz(clf, out_file=None , feature_names=['no surfacing' ,'flippers' ], class_names=['fish' , 'not fish' ], filled=True , rounded=True , special_characters=True ) graphviz.Source(dot_data) graph = graphviz.Source(dot_data) graph.render("fish" )
(6)决策树剪枝(了解) 将决策树的某些内部节点下面的节点都删掉,留下来的内部决策节点作为叶子节点。
有两种剪枝策略,分别是预剪枝和后剪枝。
① 预剪枝(pre-pruning)
构造时候就考虑剪枝
② 后剪枝(post-pruning)
构造完成再剪枝
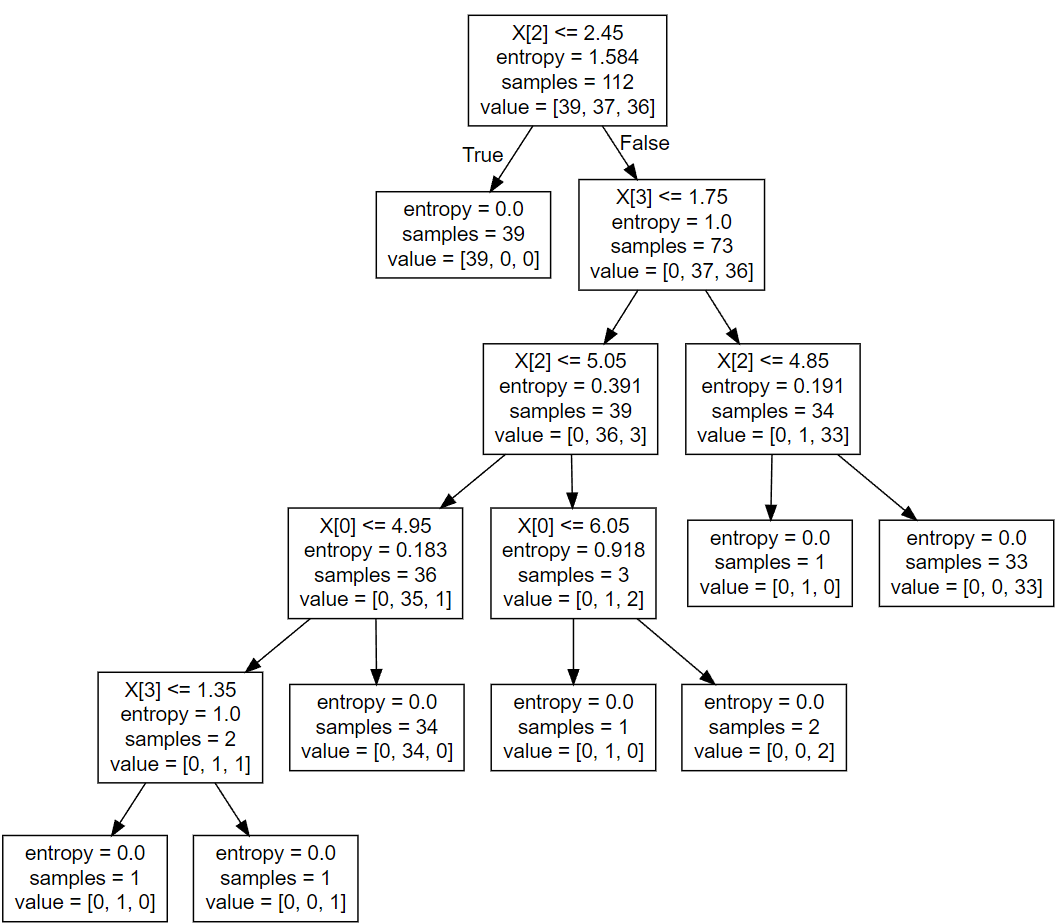
Algorithm Application in Sklearn 对鸢尾花(Iris)进行分类 1 2 3 4 5 6 7 8 9 10 11 12 13 14 15 16 17 18 19 20 21 22 23 24 25 26 27 28 29 30 import sklearnfrom sklearn.datasets import load_irisfrom sklearn.model_selection import train_test_splitfrom sklearn.tree import DecisionTreeClassifier,export_graphvizdef decision_iris (): """ 用决策树对鸢尾花分类 """ iris = load_iris() x_train,x_test,y_train,y_test = train_test_split(iris.data,iris.target,random_state=22 ) estimator = DecisionTreeClassifier(criterion="entropy" ) estimator.fit(x_train,y_train) y_predict = estimator.predict(x_test) print ("y_predict:\n" ,y_predict) print ("直接对比真实值和预测值:\n" ,y_test==y_predict) score = estimator.score(x_test,y_test) print ("准确率为:\n" ,score) export_graphviz(estimator,out_file="iris_tree.dot" ) return None if __name__ == "__main__" : decision_iris()
结果:
可视化:dot文件
1 2 3 4 5 6 7 8 9 10 11 12 13 14 15 16 17 18 19 20 21 22 23 24 25 26 27 28 29 30 31 32 33 digraph Tree { node [shape=box, fontname="helvetica" ] ; edge [fontname="helvetica" ] ; 0 [label="X[2] <= 2.45\nentropy = 1.584\nsamples = 112\nvalue = [39, 37, 36]" ] ;1 [label="entropy = 0.0\nsamples = 39\nvalue = [39, 0, 0]" ] ;0 -> 1 [labeldistance=2.5 , labelangle=45 , headlabel="True" ] ;2 [label="X[3] <= 1.75\nentropy = 1.0\nsamples = 73\nvalue = [0, 37, 36]" ] ;0 -> 2 [labeldistance=2.5 , labelangle=-45 , headlabel="False" ] ;3 [label="X[2] <= 5.05\nentropy = 0.391\nsamples = 39\nvalue = [0, 36, 3]" ] ;2 -> 3 ;4 [label="X[0] <= 4.95\nentropy = 0.183\nsamples = 36\nvalue = [0, 35, 1]" ] ;3 -> 4 ;5 [label="X[3] <= 1.35\nentropy = 1.0\nsamples = 2\nvalue = [0, 1, 1]" ] ;4 -> 5 ;6 [label="entropy = 0.0\nsamples = 1\nvalue = [0, 1, 0]" ] ;5 -> 6 ;7 [label="entropy = 0.0\nsamples = 1\nvalue = [0, 0, 1]" ] ;5 -> 7 ;8 [label="entropy = 0.0\nsamples = 34\nvalue = [0, 34, 0]" ] ;4 -> 8 ;9 [label="X[0] <= 6.05\nentropy = 0.918\nsamples = 3\nvalue = [0, 1, 2]" ] ;3 -> 9 ;10 [label="entropy = 0.0\nsamples = 1\nvalue = [0, 1, 0]" ] ;9 -> 10 ;11 [label="entropy = 0.0\nsamples = 2\nvalue = [0, 0, 2]" ] ;9 -> 11 ;12 [label="X[2] <= 4.85\nentropy = 0.191\nsamples = 34\nvalue = [0, 1, 33]" ] ;2 -> 12 ;13 [label="entropy = 0.0\nsamples = 1\nvalue = [0, 1, 0]" ] ;12 -> 13 ;14 [label="entropy = 0.0\nsamples = 33\nvalue = [0, 0, 33]" ] ;12 -> 14 ;}
然后把这个dot文件内容拉到 这个网站里面 ,或者用vscode里面的插件“Graphviz (dot) language support for Visual Studio Code”
泰坦尼克号乘客分类案例实现 流程分析 ①获取数据
②数据处理
📴缺失值处理:特征值->字典类型
③准备好特征值 ,目标值
④划分数据集
⑤特征工程
⑥决策树预估
⑦模型评估
代码 1 2 3 4 5 6 7 8 9 10 11 12 13 14 15 16 17 18 19 20 21 22 23 24 25 26 27 28 29 30 31 32 33 34 35 36 37 38 39 40 41 42 43 44 45 46 47 48 49 50 51 52 53 54 55 56 import pandas as pdfrom sklearn.model_selection import train_test_splitfrom sklearn.tree import DecisionTreeClassifier, export_graphvizfrom sklearn.feature_extraction import DictVectorizerimport numpy as npdef load_data (): data = pd.read_csv("../../titanic.csv" ) titanic = data.copy() data_used = titanic[["pclass" , "age" , "sex" , "survived" ]] real_data = pd.DataFrame(columns=["pclass" , "age" , "sex" , "survived" ]) for row in data_used.values: if not np.isnan(row[1 ]): real_data = real_data.append([{'pclass' : row[0 ], 'age' : row[1 ], 'sex' : row[2 ], 'survived' : row[3 ]}], ignore_index=True ) x = real_data[["pclass" , "age" , "sex" ]].to_dict(orient="records" ) y = real_data["survived" ] x_train, x_test, y_train, y_test = train_test_split(x, y.astype('int' ), random_state=22 ) return x_train, x_test, y_train, y_test def show_tree (estimator, feature_name ): export_graphviz(estimator, out_file="../titanic_tree.dot" , feature_names=feature_name) return None def titanic_test (): x_train, x_test, y_train, y_test = load_data() transfer = DictVectorizer() x_train = transfer.fit_transform(x_train) x_test = transfer.transform(x_test) estimator = DecisionTreeClassifier(criterion="entropy" , max_depth=12 ) estimator.fit(x_train, y_train) show_tree(estimator, transfer.get_feature_names()) y_predict = estimator.predict(x_test) print ("预测值为:" , y_predict, "\n真实值为:" , y_test, "\n比较结果为:" , y_test == y_predict) score = estimator.score(x_test, y_test) print ("准确率为: " , score) return None if __name__ == '__main__' : titanic_test()
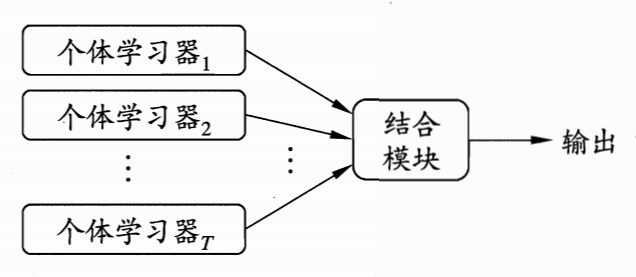
Ensemble Learning “三个臭皮匠,顶个诸葛亮”:没有创造出新的算法, 而是把已有的算法进行结合,从而得到更好的效果。
在机器学习的有监督学习算法中,我们的目标是学习出一个稳定的并且各个方面都表现很好的模型,集成学习 是组合这些多个弱监督模型来得到更好更全面的强监督模型(理解为组合金刚)
集成学习潜在的思想是即便某一个弱分类器得到了错误的预测,其他的弱分类器也可以将错误纠正回来。在周志华西瓜书中通过Hoeffding不等式证明了,随着集成中个体分类器数目的增多 ,集成的错误率将呈指数级下降 ,最终趋于零 。
数据集大:划分成多个小数据集,学习多个模型进行组合
数据集小:利用Bootstrap方法进行抽样,得到多个数据集,分别训练多个模型再进行组合
分类:
①Boosting:各学习器个体之间强依赖==必须串行==
②Bagging:各学习器个体之间不存在 强依赖==可以并行==
③Stacking:单独分类
其中①②较为常见。
Boosting:经典串行集成学习方法 请脑补计算机组成与体系结构中串行进位加法器的图
核心思想:挑选精英
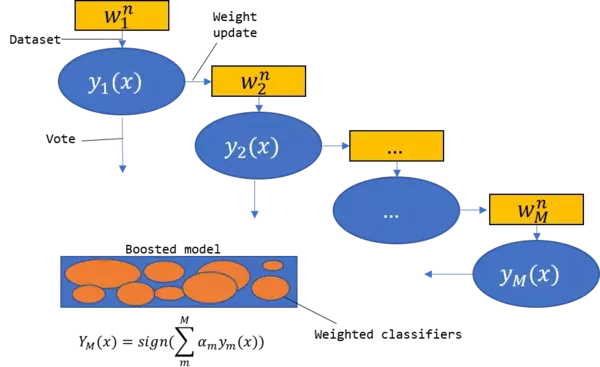
基模型按次序逐个进行训练,基模型的训练集按照某种策略每次都进行一定的转化。对所有基模型预测的结果进行线性综合产生最终的预测结果。大部分情况下,经过 Boosting 得到的结果偏差(bias)更小 。
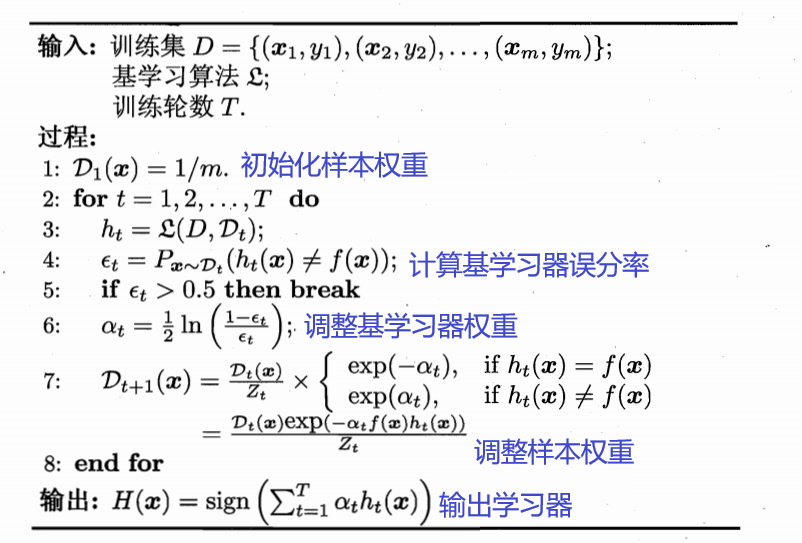
AdaBoost(Adaptive Boosting)
具体说来,算法3步走:
①初始化训练数据的权值分布。 如果有N个样本,则每一个训练样本最开始时都被赋予相同的权值:1/N。
②训练弱分类器。 具体训练过程中,如果某个样本点已经被准确地分类,那么在构造下一个训练集中,它的权值就被降低;相反,如果某个样本点没有被准确地分类,那么它的权值就得到提高。然后,权值更新过的样本集被用于训练下一个分类器,整个训练过程如此迭代地进行下去。
③将各个训练得到的弱分类器组合成强分类器。 各个弱分类器的训练过程结束后,加大分类误差率小的弱分类器的权重,使其在最终的分类函数中起着较大的决定作用,而降低分类误差率大的弱分类器的权重,使其在最终的分类函数中起着较小的决定作用。换言之,误差率低的弱分类器在最终分类器中占的权重较大,否则较小。
只可用于处理二分类任务
🤡Q:二分类是什么??
🧐A:分两类,比如垃圾邮件检测、用户流失等。
从偏差-方差分解的角度看,Boosting主要关注降低偏差 ,因此Boosting基于泛化性能相当弱的学习器可以构建出很强的集成。
代码前置知识 ①iloc函数 属于pandas库,全称“index location”
👆左侧冒号表示行 右侧冒号表示列
1 2 3 4 5 data.iloc[0 ] data.iloc[1 ] data.iloc[:] / data.iloc[0 :] / data.iloc[:,:] data.iloc[1 :] data.iloc[2 :, 3 :]
在本案例中的代码解释在对应注释 里面
②sklearn的转换库 作用:清洗,降维,提取特征等。
数据转换中有3种很重要的方法:fit,fit_transform,transform
fit:
求得训练集X的均值,方差,最大值,最小值这些训练集X固有的属性。(入门级)
transform:
在fit的基础上,进行标准化,降维,归一化等操作。
fit_transform:
“joins the fit() and transform() method for transformation of dataset.”
很高效的将模型训练和转化合并到一起,训练样本先做fit,得到mean(均值),standard deviation(标准差),然后将这些参数用于transform(归一化训练数据),使得到的训练数据是归一化的。
注意🖐
·运行结果一模一样不代表这两个函数可以互相替换,绝对不可以!!!(目前我还没有遇到类似的问题,毕竟刚刚接触ML)
解释👱♂️
·sklearn里的封装好的各种算法都要fit、然后调用各种API方法,transform只是其中一个API方法,所以当你调用除transform之外的方法,必须要先fit,为了通用的写代码,还是分开写比较好
·也就是说,这个fit相对于transform而言是没有任何意义的,但是相对于整个代码而言,fit是为后续的API函数服务的,所以fit_transform不能改写为transform。
③np.arange() 函数返回 一个有终点和起点的固定步长的排列,如[1,2,3,4,5],起点是1,终点是6,步长为1。
参数:
·1个参数:参数值为终点,步长默认取1
·2个参数:起点——>终点,步长默认取1
·3个参数:起点——>终点,步长任意,支持小数
④np.meshgrid() 👉讲解
Code 1 2 3 4 5 6 7 8 9 10 11 12 13 14 15 16 17 18 19 20 21 22 23 24 25 26 27 28 29 30 31 32 33 34 35 36 37 import numpy as npimport pandas as pdimport seaborn as snsimport matplotlib.pyplot as pltfrom sklearn.preprocessing import LabelEncoderfrom sklearn.ensemble import AdaBoostClassifierfrom sklearn.tree import DecisionTreeClassifieriris = sns.load_dataset("iris" ) x = iris.iloc[:100 ].iloc[:,[0 ,1 ]] y = iris.iloc[:100 ].iloc[:,-1 ] encoder = LabelEncoder() y = encoder.fit_transform(y) x = np.array(x) y = np.array(y) plt.scatter(x[:,0 ],x[:,1 ],c=y) plt.show() weakClassifier = DecisionTreeClassifier(max_depth=2 ) clf = AdaBoostClassifier(base_estimator=weakClassifier,algorithm='SAMME' ,n_estimators=300 ,learning_rate=0.8 ) clf.fit(x,y) x1_min = x[:,0 ].min () - 1 x1_max = x[:,0 ].max () + 1 x2_min = x[:,1 ].min () - 1 x2_max = x[:,1 ].max () + 1 x1_ , x2_ = np.meshgrid(np.arange(x1_min,x1_max,0.02 ),np.arange(x2_min,x2_max,0.02 )) y_=clf.predict(np.c_[x1_.ravel(),x2_.ravel()]) y_=y_.reshape(x1_.shape) plt.contourf(x1_,x2_,y_,cmap=plt.cm.Paired) plt.scatter(x[:,0 ],x[:,1 ],c=y) plt.show()
Bagging:经典并行集成学习方法
具体步骤如下:
采用重抽样方法(有放回抽样)从原始样本中抽取一定数量的样本 根据抽出的样本计算想要得到的统计量M 重复上述T次(一般大于1000),得到T个统计量T 根据这T个统计量,即可计算出统计量的置信区间
Eg:Random Forest ·包含多个决策树的分类器。🌲+🌲+🌲
eg:4个🌲是true,1个🌲是false,那么结果就是true
假设训练集有N个样本,M个特征
·Random体现&建造每棵树的算法:
训练集随机:BootStrap抽样(随机有放回抽样 ),N个样本随机有放回抽样N个。
特征随机:从M个特征选m个特征(M>>m:降维 )
这样一来,正确的树是互相吻合的,错误的数会错的各不相同。
Advantages ①训练可以高度并行化,可以有效运行在大数据集上。
②对部分特征的缺失容忍度高。
③由于有了样本和属性的采样,最终训练出来的模型泛化能力强。
✍泛化能力(generalization ability):ML算法对新样本的适应能力.
Disadvantages ①在某些噪声比较大的样本集上,随机森林容易陷入过拟合。
②取值划分比较多的特征容易对随机森林的决策产生更大的影响,从而影响拟合的模型效果。
👇Example 1 2 3 4 5 6 7 8 9 10 11 12 13 14 15 16 17 18 19 20 21 22 23 24 25 26 27 28 29 30 31 32 33 34 35 36 37 38 39 40 41 42 43 44 45 46 47 48 49 50 51 52 53 54 55 56 57 58 59 60 61 62 63 64 65 66 67 68 69 import pandas as pdfrom sklearn.model_selection import train_test_split, GridSearchCVfrom sklearn.feature_extraction import DictVectorizerfrom sklearn.ensemble import RandomForestClassifierimport numpy as np""" # 随机森林就是多个树, 最后通过投票选择多数的那个决策 # 随机有两种方式 # 1: 每一个树训练集不同 # 2: 需要训练的特征进行随机分配 从特定的特征集里面抽取一些特征来分配 """ def load_data (): data = pd.read_csv("../../titanic.csv" ) titanic = data.copy() data_used = titanic[["pclass" , "age" , "sex" , "survived" ]] real_data = pd.DataFrame(columns=["pclass" , "age" , "sex" , "survived" ]) for row in data_used.values: if not np.isnan(row[1 ]): real_data = real_data.append([{'pclass' : row[0 ], 'age' : row[1 ], 'sex' : row[2 ], 'survived' : row[3 ]}], ignore_index=True ) x = real_data[["pclass" , "age" , "sex" ]].to_dict(orient="records" ) y = real_data["survived" ] x_train, x_test, y_train, y_test = train_test_split(x, y.astype('int' ), random_state=22 ) return x_train, x_test, y_train, y_test def titanic_ramdo_test (): x_train, x_test, y_train, y_test = load_data() transfer = DictVectorizer() x_train = transfer.fit_transform(x_train) x_test = transfer.transform(x_test) estimator = RandomForestClassifier() param_dict = {"n_estimators" : [120 , 200 , 300 , 500 , 800 , 1200 ], "max_depth" : [5 , 8 , 15 , 25 , 30 ]} estimator = GridSearchCV(estimator, param_grid=param_dict, cv=3 ) estimator.fit(x_train, y_train) y_predict = estimator.predict(x_test) print ("预测值为:" , y_predict, "\n真实值为:" , y_test, "\n比较结果为:" , y_test == y_predict) score = estimator.score(x_train, y_train) print ("准确率为: " , score) print ("最佳参数:\n" , estimator.best_params_) print ("最佳结果:\n" , estimator.best_score_) print ("最佳估计器:\n" , estimator.best_estimator_) print ("交叉验证结果:\n" , estimator.cv_results_) return None if __name__ == '__main__' : titanic_ramdo_test()
